A Markov Chain Analysis of Social Media
Mathematical Modeling of Social Media as a Distraction
To mathematically "prove" (or more accurately, model) that social media functions as a distraction, we can use a Discrete-Time Markov Chain (DTMC). We will model the user's attention span as a stochastic process moving between two primary states.
The goal is to show that even small probabilities of checking notifications lead to a disproportionate amount of time lost due to the design of social media algorithms.
1. Defining the State Space
Let be the state of the user at time . We define two states:
- State (Flow/Focus): The user is productive and working.
- State (Distraction/Social Media): The user is scrolling or engaging with social media.
The state space is .
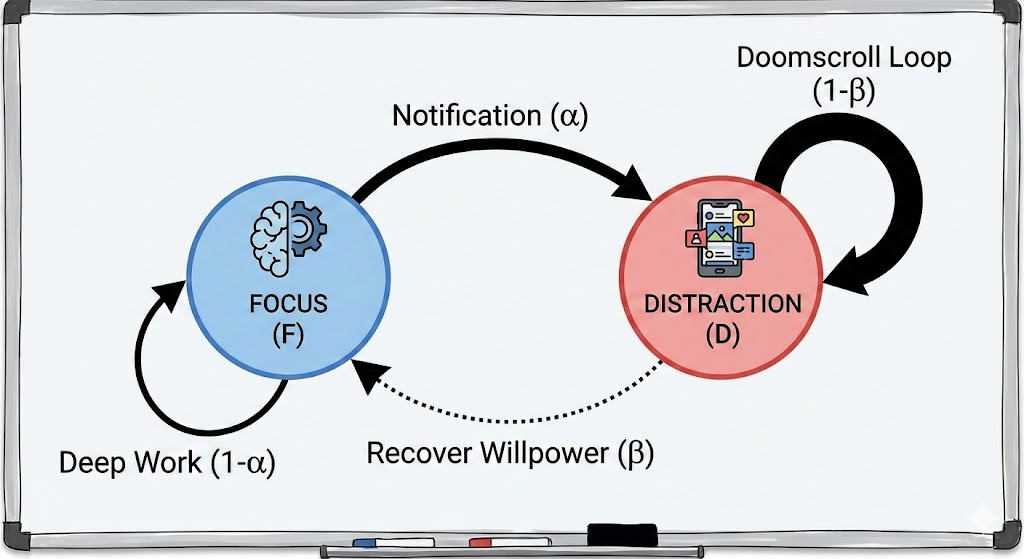
2. The Transition Matrix
We define the Transition Probability Matrix , which describes the probability of moving from one state to another in the next time step (e.g., the next minute).
Where:
- : The probability of getting distracted (moving from Focus to Distraction). This is triggered by notifications or internal boredom.
- : The probability of staying focused.
- : The probability of recovering (moving from Distraction back to Focus).
- : The probability of staying distracted (the "stickiness" or "doomscrolling" factor).
The matrix becomes:
3. The "Stickiness" Hypothesis
Social media platforms are engineered to maximize user retention. Mathematically, this means they aim to make (staying distracted) very close to 1, or conversely, make (the recovery rate) very small.
- (Distraction rate) is often non-zero but small (e.g., one notification every 30 minutes).
- (Recovery rate) is notoriously low because algorithms serve endless content to prevent you from leaving state .
4. Steady-State Analysis (The Long-Run "Proof")
To find the proportion of time a user effectively spends in the Distraction state, we calculate the stationary distribution , where .
This results in the system of equations:
Solving for (the total fraction of time spent on social media):
The Mathematical Implication:
Even if your distraction trigger is small, if the recovery rate is also small (which it is, due to infinite scroll features), becomes large.
Example:
- If you have a 5% chance of checking your phone per minute ().
- But you only have a 5% chance of putting it down once you start ().
- Then .
Result: You spend 50% of your time distracted, despite having a 95% intention to stay focused at any given moment in the Focus state.
5. First Passage Time (The Destruction of Deep Work)
We can also model "Deep Work" as requiring consecutive time steps in state .
If is the random variable representing the time until the first distraction (First Passage Time from to ), it follows a Geometric distribution with parameter .
The expected time until interruption is:
If a task requires 30 minutes of unbroken concentration () and (a 10% chance of distraction per minute), the probability of completing that 30-minute block without interruption is:
Conclusion: Under this stochastic model, there is only a 4.2% chance of achieving a 30-minute block of deep work, proving that even minor social media connectivity mathematically obliterates the probability of sustained focus.
Summary
The mathematics of Markov chains proves social media is a distraction because:
- Stationary Distribution: The low recovery rate () dominates the equation, skewing the long-term average heavily toward distraction.
- Geometric Decay: The probability of sustaining long sequences of State decays exponentially with every time step that social media remains an available option.
More Realistic Approach
The previous 2-state model () was actually too optimistic because it assumed that the moment you put your phone down, you immediately return to 100% productivity (State ).
In reality, neuroscience and cognitive psychology (specifically research by Gloria Mark at UC Irvine) suggest it takes an average of 23 minutes to return to a task after an interruption. This is called the "Switching Cost."
To make this realistic, we must introduce a 3-State Markov Chain and analyze the "Hidden Waste" caused by attention residue.
This model mathematically proves that "doomscrolling" is not just about time spent on a phone; it is about the statistical impossibility of escaping the loop once you enter it.
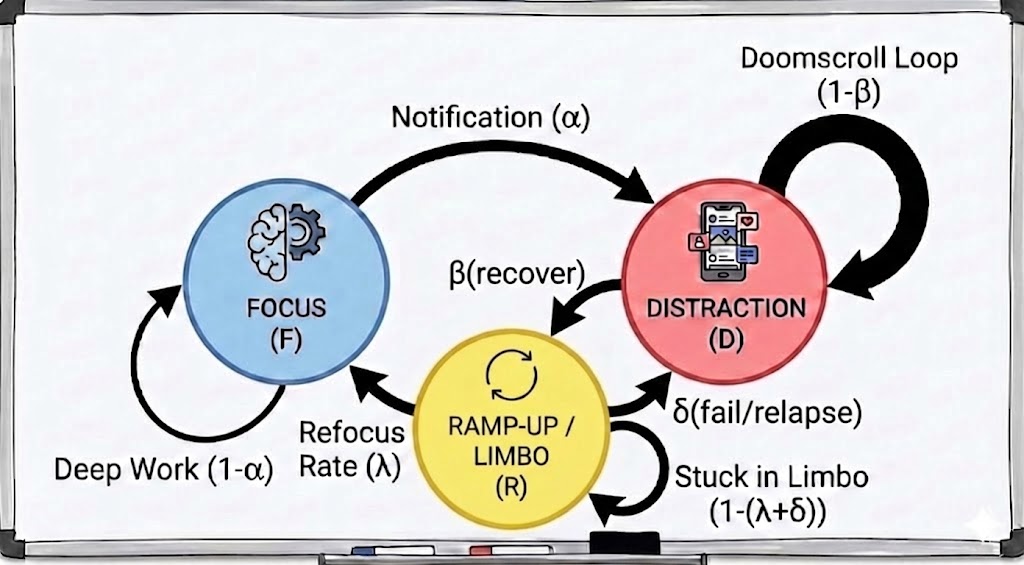
1. The State Space: Where Your Brain Actually Is
We define three states to represent the reality of cognitive work:
- (Focus): Deep, productive work (The Goal).
- (Distraction): Active social media usage / scrolling.
- (Ramp-up / Limbo): The critical "switching cost" period. You are not scrolling, but you are not yet focused. You are staring at the screen, buffering, or trying to remember what you were doing.
2. The Four Critical Parameters
To model this realistically, we need four variables, not three:
- (Distraction Rate): The probability of leaving Focus (). Source: Notifications, internal boredom.
- (Recovery Rate): The probability of stopping the scroll (). Note: A low means high "stickiness" (infinite scroll).
- (Refocus Rate): The probability of successfully entering Flow from Ramp-up (). Biological Limit: Your brain takes ~23 mins to refocus, so .
- (Relapse Rate): The new parameter. The probability of getting distracted again while trying to refocus (). Scenario: You close Instagram, open your laptop, feel a split-second of boredom (State ), and immediately pick your phone back up (State ).
3. The Full Transition Matrix ()
The matrix now accounts for the "Relapse Loop" where you fall back into distraction without ever reaching focus.
- Row 1 (Focus): You stay focused or get distracted ().
- Row 2 (Distraction): You stay distracted or try to recover (). You cannot jump straight to Focus.
- Row 3 (Ramp-up): The danger zone. You either succeed (), fail/relapse (), or stay stuck in limbo ().
4. Steady-State Analysis: The "Doom Loop" Proof
We solve for the stationary distribution (the % of time you are actually productive).
The Balance Equations (Rate In = Rate Out):
- For Node F: (Meaning: You can only enter Focus from Ramp-up.)
- For Node D: (Meaning: You enter Distraction from Focus () OR from a Relapse (). This is where the model punishes you.)
Solving for (Total Distraction Time): Substitute into equation (2):
The New Efficiency Formula:
Using :
Here is the mathematical breakdown of the three "Working Modes" using our derived Efficiency Formula, followed by the "Attention Residue" metric.
The Master Formula
Recall our efficiency equation for (Time in Deep Work):
The Constants (for all cases): We assume a "typical" modern workflow:
- : You get a notification/urge every 20 minutes.
- : You scroll for average 10 minutes before stopping.
- : It takes 20 minutes to mentally refocus (The Gloria Mark Constant).
Case A: The Ideal Worker (No Relapse)
- Condition: . You never check your phone while trying to refocus. You only get distracted from the Flow state.
- The Math:
- Switching Cost:
- Relapse Multiplier: (No penalty)
- Distraction Cost:
- Result: Even with perfect discipline during the ramp-up phase, biological switching costs limit you to 40% productivity (3.2 hours in an 8-hour day).
Case B: The "Struggling" Worker (The Double Dip)
- Condition: . You are just as likely to relapse as you are to focus.
- Scenario: You sit down to work, open a document, but "quickly" check email before typing.
- The Math:
- Relapse Multiplier:
- Distraction Cost: The distraction penalty doubles.
- Result: Your productivity drops. You are now spending equal time "working," "ramping up," and "scrolling."
Case C: The "Death Spiral" (Absorbing State)
- Condition: (4x higher than ). Your environment is highly distracting. You are 4 times more likely to check your phone than to successfully focus.
- Scenario: Phone is on the desk, face up, notifications on.
- The Math:
- Relapse Multiplier:
- Distraction Cost: The penalty explodes.
- The Implication: In an 8-hour workday, you only get 1.7 hours of work done. The rest of the time is lost not just to scrolling, but to the Relapse Loop () where you are constantly trying to start but never succeeding.
3. The "Attention Residue" Metric ()
Even if you achieve the 40% time () from Case A, your output quality might still be near zero. We model Productive Output () as Time Quality:
The Quality Function
Cognitive science suggests quality is not binary; it accumulates.
- starts at 0 when you enter Flow.
- It slowly rises to 1 (Peak Cognitive Capacity).
- Critical Rule: Any transition to resets to 0.
The "Shallow Work" Trap
If (distraction rate) is high, the average time spent in Flow () is short ().
- If it takes 15 minutes to reach peak mental depth ()...
- But your average interruption is every 10 minutes ()...
- Then mathematically:
Conclusion: In Cases B and C, not only is low (little time spent working), but is constantly cut short by the high and . This means you are effectively performing "Staccato Work"—short bursts of low-quality effort () that never allow for complex problem solving. You are busy, but you are not producing value.
6. Summary of Metrics
| Symbol | Name | Real-World Meaning | Mathematical Impact |
|---|---|---|---|
| Distraction Trigger | Notifications, open tabs. | Linear reduction in focus. | |
| Escape Velocity | Willpower to close the app. | Determines length of a single scroll session. | |
| Refocus Speed | Cognitive "warm-up" time. | The bottleneck. Biological constant (~23 mins). | |
| Relapse Risk | The Danger Variable. Checking phone during warm-up. | Multiplicative damage. Can drive productivity to 0%. |